Upper Arlington's Median Price Jumped This Year. Did the Houses Actually Get More Expensive?
October 15, 2026
October 15, 2026
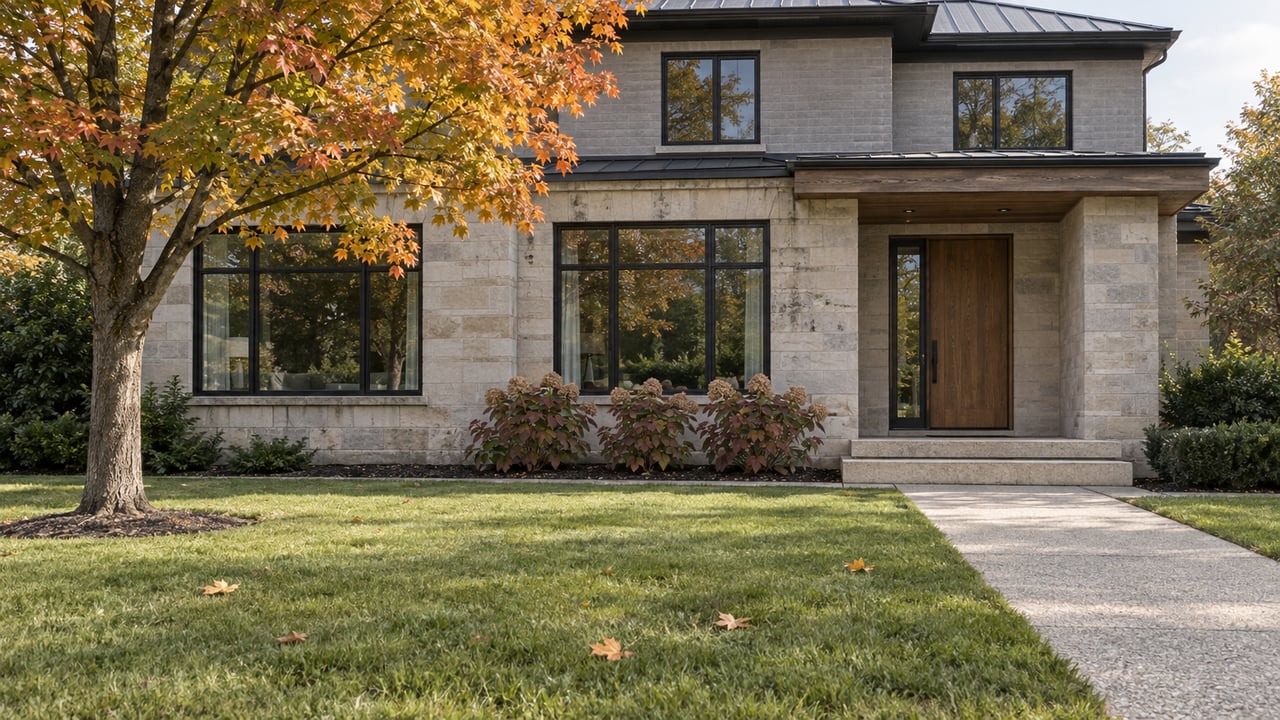
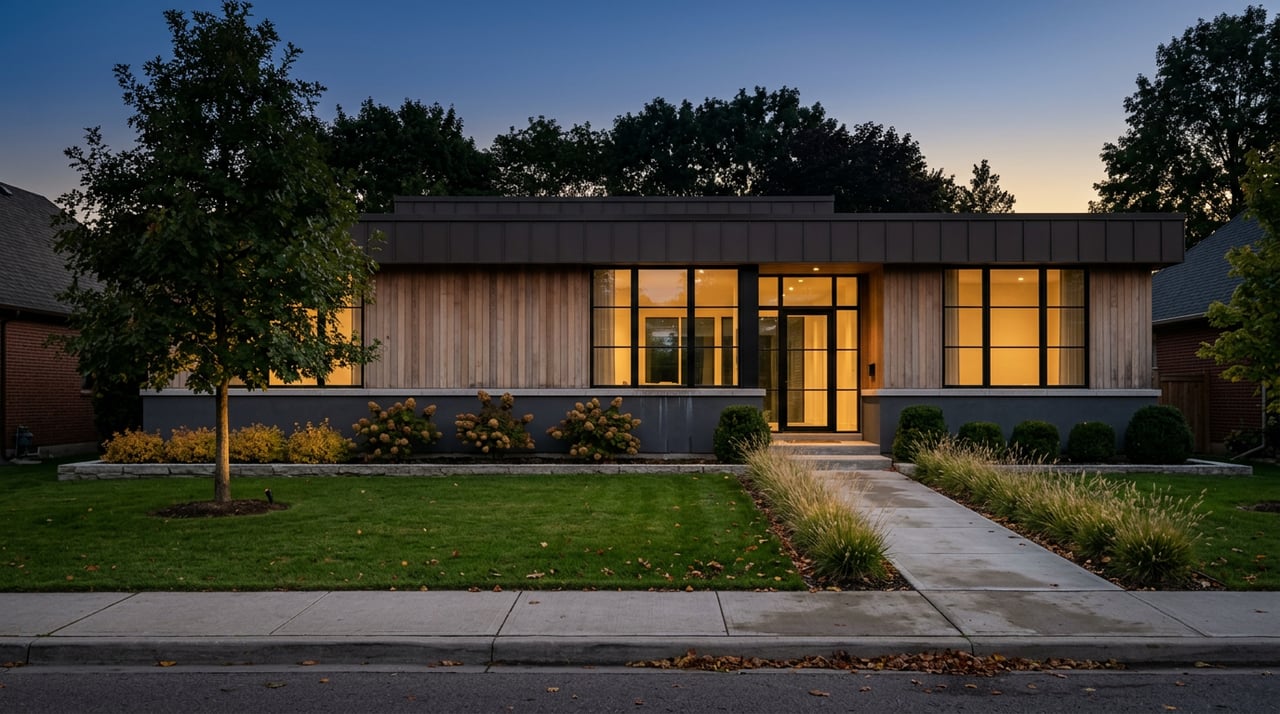
On April 21, 2026, a newly designed custom home at 3163 S. Dorchester Road sold for $1,950,000. Two days later, 2729 Eastcleft Drive closed at $2,208,500. The Columbus Dispatch listed both among the top residential transfers in Franklin County that week. Earlier that month, the Tuckerman Home Group's 2026 portfolio had shown the Dorchester house as in contract, alongside other custom designs the builder lists as coming soon in Upper Arlington.
Sales like these don't change what the 1950s ranch next door is worth. They do change the median. That gap between what the median reports and what a typical house gained is the most useful thing to understand about Upper Arlington pricing in 2026.
The Columbus REALTORS Local Market Update for the Upper Arlington City School District puts the year-to-date median sale price through September 2026 at $675,000, up 10.1% from $613,000 over the same stretch of 2025. The same report puts year-to-date average price per square foot at $350.19, up 2.5% from $341.76.
One September report could be noise, but the same gap shows up at every month-end this summer:
| Year to date through | Median sale price change | Avg. price per sq ft change |
|---|---|---|
| June 2026 | +11.4% | +3.4% |
| July 2026 | +11.7% | +3.1% |
| August 2026 | +11.4% | +3.2% |
| September 2026 | +10.1% | +2.5% |
For four straight months, the median has run three to four times faster than price per square foot. If every home were simply worth more, the two figures would move roughly together. They haven't.
A median sale price is the middle sale among the homes that happened to close. It doesn't track the same house from one year to the next. When a larger share of the closings are bigger or newer homes, the middle moves up even if no individual house gained much value.
Price per square foot corrects for one piece of that, which is size. A 4,500-square-foot new build and a 1,600-square-foot original ranch can land close together on price per square foot even when their sale prices are more than a million dollars apart. A modest rise in price per square foot alongside a big rise in the median fits a year when more of the large homes changed hands.
The data fits that explanation, though it doesn't prove it. Average sale price through September 2026 rose 9.0%, from $724,269 to $789,540, which also points to more sales at the high end. The custom-build pipeline is real and specific. Tuckerman's 2026 page lists upcoming work at 2520 Eastcleft Drive, 2300 Hoxton Court and 2752 Folkstone Road. Its 2025 page lists completed and sold custom homes on Redding Road and Sandover Road. Each finished home like these adds a large, expensive sale to a district that recorded 371 closings through September. In a sample that small, a few dozen high-end closings can shift the median noticeably.
If the mix is what's lifting the median, a month with fewer high-end closings should show the median stalling. September 2026 did exactly that.
Upper Arlington recorded 38 closings in September 2026, down from 47 in September 2025. The median for the month was $599,500, essentially flat against $600,000 a year earlier. Average sale price fell 14.3%, to $660,741 from $770,668. Average price per square foot dipped 4.0%, to $324.96.
One month of 38 sales isn't a trend, and the report itself cautions that small samples can make percent changes look extreme. Still, a 14% drop in the average with almost no change in the median points to fewer very large sales in the month. It doesn't point to broadly falling values. The same mix effect that pushed the median up all spring took it back down for one month once the top end thinned out.
Supply also changed this year. Inventory in the district stood at 72 homes in September 2026, up 26.3% from 57 a year earlier, which works out to 1.7 months of supply compared with 1.4. Through September, sellers received 100.2% of their original list price on average, slightly below the 100.4% a year earlier.
That isn't a soft market. Days on market until sale was 16 year to date through September 2026, down from 20, and the September 2026 figure was 17 days compared with 31 the year before. Homes that are priced well still move quickly. But a district with somewhat more inventory and roughly 2.5% gains in price per square foot looks very different from one where everything is up 10%.
Here is the difference in dollar terms, using the district's own numbers. A 10.1% gain on $613,000 is about $62,000. A 2.5% gain on the same figure is about $15,000. A buyer who assumes the first number may feel priced out of homes that have actually risen by something closer to the second. A seller who prices an unchanged house off the headline may be asking for value the comps don't support.
The same split shows up next door. In the Worthington City School District, the year-to-date median through September 2026 rose 8.3%, from $400,000 to $433,000. Average price per square foot over the same period was essentially flat, $252.58 compared with $252.42, a change of 0.1%.
So when you compare suburbs, side-by-side median gains can mislead in both places. Each median is shaped by its own mix of sales. Price per square foot, read alongside the type and age of the homes that sold, comes closer to an equal comparison. It's still a rough tool: an updated home and an original one of the same size can sell far apart, and price per square foot can't capture lot size, condition or location within the district.
These habits keep the mix effect from skewing an offer or a list price:
New custom homes on streets like Dorchester, with more listed as coming soon on Eastcleft and Folkstone, are raising what the top of Upper Arlington sells for. Whether your own address gained 10% this year depends on how it compares with its direct comps, not on the district median.
Are Upper Arlington home prices up 10% in 2026? The median sale price for the Upper Arlington City School District rose 10.1% year to date through September 2026. Average price per square foot rose 2.5% over the same period. The bigger figure reflects which homes sold as much as how values changed.
Why was the September 2026 median flat? September 2026 had 38 closings, and the average sale price fell 14.3% while the median barely moved. That pattern fits a month with fewer very high-priced sales. One month of data is too small to call it a trend.
Is the Upper Arlington market slowing? Inventory was 72 homes in September 2026, up from 57 a year earlier, for 1.7 months of supply. Homes still sold quickly, with 17 days on market until sale for September 2026.
If you're weighing a sale in Upper Arlington and want to know what your home's direct comps support beyond the district median, Guided Property Sales can build that comparison for your specific street and home type. Request your VIP home valuation.

We pride ourselves in providing personalized solutions that bring our clients closer to their dream properties and enhance their long-term wealth. Contact us today to find out how we can be of assistance to you!